import numpy as np
from matplotlib import pyplot as plt
import moraine.cli as mcTransform
transform coordinate between projection
transform
transform (xx_in, yy_in, xx_out, yy_out, epsg_in=4326, epsg_out=3857)
Coordinate transformation. By default, the input should be longitude (xx_in) and latitude (yy_in) (in degree) and outputs are x (east) and y (south) coordinate in web mercator projection (for plot with google earth map). The chunks, shape and dtype of output are same as xx_in.
| Type | Default | Details | |
|---|---|---|---|
| xx_in | input x coordinate | ||
| yy_in | input y coordinate | ||
| xx_out | output x coordinate | ||
| yy_out | output y coordinate | ||
| epsg_in | int | 4326 | input epsg |
| epsg_out | int | 3857 | output epsg |
transform do not have the API version since it can be easily achieved with pyproj.
Usage:
lon_ = './raw/lon.zarr/'; lat_ = './raw/lat.zarr/'
e_ = './transform/e.zarr'; n_ = './transform/n.zarr'
logger = mc.get_logger()transform(lon_,lat_,e_,n_)2025-09-18 12:17:27 - log_args - INFO - running function: transform
2025-09-18 12:17:27 - log_args - INFO - fetching args:
2025-09-18 12:17:27 - log_args - INFO - xx_in = './raw/lon.zarr/'
2025-09-18 12:17:27 - log_args - INFO - yy_in = './raw/lat.zarr/'
2025-09-18 12:17:27 - log_args - INFO - xx_out = './transform/e.zarr'
2025-09-18 12:17:27 - log_args - INFO - yy_out = './transform/n.zarr'
2025-09-18 12:17:27 - log_args - INFO - epsg_in = 4326
2025-09-18 12:17:27 - log_args - INFO - epsg_out = 3857
2025-09-18 12:17:27 - log_args - INFO - fetching args done.
2025-09-18 12:17:27 - transform - INFO - input EPSG: 4326.
2025-09-18 12:17:27 - zarr_info - INFO - xx_in zarray shape, chunks, dtype: (2500, 1834), (1000, 1000), float64
2025-09-18 12:17:27 - zarr_info - INFO - yy_in zarray shape, chunks, dtype: (2500, 1834), (1000, 1000), float64
2025-09-18 12:17:27 - transform - INFO - output EPSG: 3857.
2025-09-18 12:17:27 - transform - INFO - do the transformation.
2025-09-18 12:17:29 - transform - INFO - write output.
2025-09-18 12:17:29 - transform - INFO - write done.lon = zarr.open(lon_,mode='r')[:]
lat = zarr.open(lat_,mode='r')[:]fig,axes = plt.subplots(1,2,figsize=(11,5))
im0 = axes[0].imshow(lon)
axes[0].set_title('Longitude')
fig.colorbar(im0, ax=axes[0])
im1 = axes[1].imshow(lat)
axes[1].set_title('Latitude')
fig.colorbar(im1, ax=axes[1])
fig.show()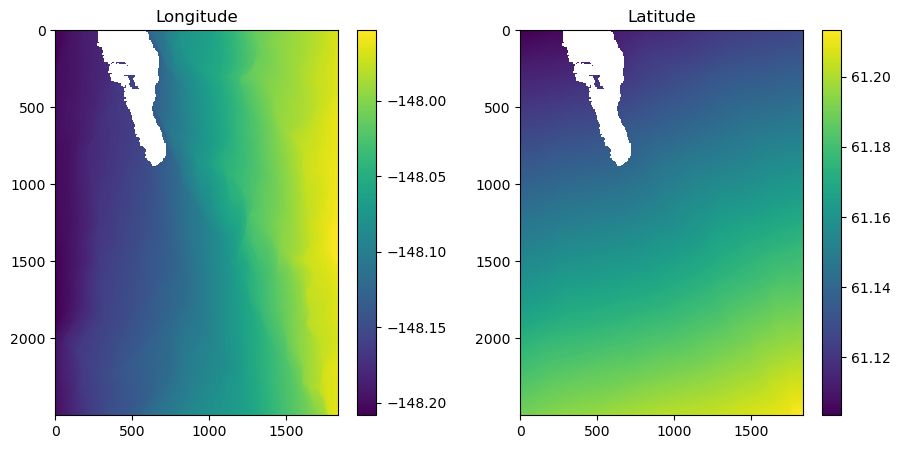
e = zarr.open(e_,mode='r')[:]
n = zarr.open(n_,mode='r')[:]
fig,axes = plt.subplots(1,2,figsize=(11,5))
im0 = axes[0].imshow(e)
axes[0].set_title('E')
fig.colorbar(im0, ax=axes[0])
im1 = axes[1].imshow(n)
axes[1].set_title('N')
fig.colorbar(im1, ax=axes[1])
fig.show()