import holoviews as hv
from holoviews import opts
import numpy as np
from bokeh.models import WheelZoomTool
import moraine.cli as mcPlot
raster plot
ras_pyramid
ras_pyramid (ras:str, out_dir:str, chunks:tuple[int,int]=(256, 256), processes=False, n_workers=1, threads_per_worker=2, **dask_cluster_arg)
render raster data to pyramid of difference zoom levels.
| Type | Default | Details | |
|---|---|---|---|
| ras | str | path to input data, 2D zarr array (one single raster) or 3D zarr array (a stack of rasters) | |
| out_dir | str | output directory to store rendered data | |
| chunks | tuple | (256, 256) | output raster tile size |
| processes | bool | False | use process for dask worker over thread |
| n_workers | int | 1 | number of dask worker |
| threads_per_worker | int | 2 | number of threads per dask worker |
| dask_cluster_arg | VAR_KEYWORD |
[ras_pyramid](https://kanglcn.github.io/moraine/CLI/plot.html#ras_pyramid) render one single raster (2D array) or a stack of rasters (2D array) into tiles of difference resolution (zoom level).
adi = 'ps/adi.zarr'
rslc = 'raw/rslc.zarr'
adi_pyramid_dir = 'plot/adi_pyramid'
rslc_pyramid_dir = 'plot/rslc_pyramid'logger = mc.get_logger()ras_pyramid(adi,adi_pyramid_dir)2025-10-23 21:28:45 - log_args - INFO - running function: ras_pyramid
2025-10-23 21:28:45 - log_args - INFO - fetching args:
2025-10-23 21:28:45 - log_args - INFO - ras = 'ps/adi.zarr'
2025-10-23 21:28:45 - log_args - INFO - out_dir = 'plot/adi_pyramid'
2025-10-23 21:28:45 - log_args - INFO - chunks = (256, 256)
2025-10-23 21:28:45 - log_args - INFO - processes = False
2025-10-23 21:28:45 - log_args - INFO - n_workers = 1
2025-10-23 21:28:45 - log_args - INFO - threads_per_worker = 2
2025-10-23 21:28:45 - log_args - INFO - dask_cluster_arg = {}
2025-10-23 21:28:45 - log_args - INFO - fetching args done.
2025-10-23 21:28:45 - ras_pyramid - INFO - clean out dir
2025-10-23 21:28:45 - zarr_info - INFO - ps/adi.zarr zarray shape, chunks, dtype: (2500, 1834), (1000, 1000), float32
2025-10-23 21:28:45 - ras_pyramid - INFO - rendered raster pyramid with zoom level ranging from 0 (finest resolution) to 10 (coarsest resolution).
2025-10-23 21:28:47 - ras_pyramid - INFO - dask local cluster started.
2025-10-23 21:28:47 - dask_cluster_info - INFO - dask cluster: LocalCluster(dashboard_link='http://10.211.48.7:8787/status', workers=1, threads=2, memory=256.00 GiB)
2025-10-23 21:28:47 - zarr_info - INFO - plot/adi_pyramid/0.zarr zarray shape, chunks, dtype: (2500, 1834), (256, 256), float32
2025-10-23 21:28:47 - zarr_info - INFO - plot/adi_pyramid/1.zarr zarray shape, chunks, dtype: (1250, 917), (256, 256), float32
2025-10-23 21:28:47 - zarr_info - INFO - plot/adi_pyramid/2.zarr zarray shape, chunks, dtype: (625, 459), (256, 256), float32
2025-10-23 21:28:47 - zarr_info - INFO - plot/adi_pyramid/3.zarr zarray shape, chunks, dtype: (313, 230), (256, 256), float32
2025-10-23 21:28:47 - zarr_info - INFO - plot/adi_pyramid/4.zarr zarray shape, chunks, dtype: (157, 115), (256, 256), float32
2025-10-23 21:28:47 - zarr_info - INFO - plot/adi_pyramid/5.zarr zarray shape, chunks, dtype: (79, 58), (256, 256), float32
2025-10-23 21:28:47 - zarr_info - INFO - plot/adi_pyramid/6.zarr zarray shape, chunks, dtype: (40, 29), (256, 256), float32
2025-10-23 21:28:47 - zarr_info - INFO - plot/adi_pyramid/7.zarr zarray shape, chunks, dtype: (20, 15), (256, 256), float32
2025-10-23 21:28:47 - zarr_info - INFO - plot/adi_pyramid/8.zarr zarray shape, chunks, dtype: (10, 8), (256, 256), float32
2025-10-23 21:28:47 - zarr_info - INFO - plot/adi_pyramid/9.zarr zarray shape, chunks, dtype: (5, 4), (256, 256), float32
2025-10-23 21:28:47 - zarr_info - INFO - plot/adi_pyramid/10.zarr zarray shape, chunks, dtype: (3, 2), (256, 256), float32
2025-10-23 21:28:47 - ras_pyramid - INFO - computing graph setted. doing all the computing.
2025-10-23 21:28:47 - ras_pyramid - INFO - computing finished. 0.3s
2025-10-23 21:28:47 - ras_pyramid - INFO - dask cluster closed.ras_pyramid(rslc,rslc_pyramid_dir)2025-10-23 21:28:47 - log_args - INFO - running function: ras_pyramid
2025-10-23 21:28:47 - log_args - INFO - fetching args:
2025-10-23 21:28:47 - log_args - INFO - ras = 'raw/rslc.zarr'
2025-10-23 21:28:47 - log_args - INFO - out_dir = 'plot/rslc_pyramid'
2025-10-23 21:28:47 - log_args - INFO - chunks = (256, 256)
2025-10-23 21:28:47 - log_args - INFO - processes = False
2025-10-23 21:28:47 - log_args - INFO - n_workers = 1
2025-10-23 21:28:47 - log_args - INFO - threads_per_worker = 2
2025-10-23 21:28:47 - log_args - INFO - dask_cluster_arg = {}
2025-10-23 21:28:47 - log_args - INFO - fetching args done.
2025-10-23 21:28:47 - ras_pyramid - INFO - clean out dir
2025-10-23 21:28:48 - zarr_info - INFO - raw/rslc.zarr zarray shape, chunks, dtype: (2500, 1834, 17), (1000, 1000, 1), complex64
2025-10-23 21:28:48 - ras_pyramid - INFO - rendered raster pyramid with zoom level ranging from 0 (finest resolution) to 10 (coarsest resolution).
2025-10-23 21:28:48 - ras_pyramid - INFO - dask local cluster started.
2025-10-23 21:28:48 - dask_cluster_info - INFO - dask cluster: LocalCluster(dashboard_link='http://10.211.48.7:8787/status', workers=1, threads=2, memory=256.00 GiB)
2025-10-23 21:28:48 - zarr_info - INFO - plot/rslc_pyramid/0.zarr zarray shape, chunks, dtype: (2500, 1834, 17), (256, 256, 1), complex64
2025-10-23 21:28:48 - zarr_info - INFO - plot/rslc_pyramid/1.zarr zarray shape, chunks, dtype: (1250, 917, 17), (256, 256, 1), complex64
2025-10-23 21:28:48 - zarr_info - INFO - plot/rslc_pyramid/2.zarr zarray shape, chunks, dtype: (625, 459, 17), (256, 256, 1), complex64
2025-10-23 21:28:48 - zarr_info - INFO - plot/rslc_pyramid/3.zarr zarray shape, chunks, dtype: (313, 230, 17), (256, 256, 1), complex64
2025-10-23 21:28:48 - zarr_info - INFO - plot/rslc_pyramid/4.zarr zarray shape, chunks, dtype: (157, 115, 17), (256, 256, 1), complex64
2025-10-23 21:28:48 - zarr_info - INFO - plot/rslc_pyramid/5.zarr zarray shape, chunks, dtype: (79, 58, 17), (256, 256, 1), complex64
2025-10-23 21:28:48 - zarr_info - INFO - plot/rslc_pyramid/6.zarr zarray shape, chunks, dtype: (40, 29, 17), (256, 256, 1), complex64
2025-10-23 21:28:48 - zarr_info - INFO - plot/rslc_pyramid/7.zarr zarray shape, chunks, dtype: (20, 15, 17), (256, 256, 1), complex64
2025-10-23 21:28:48 - zarr_info - INFO - plot/rslc_pyramid/8.zarr zarray shape, chunks, dtype: (10, 8, 17), (256, 256, 1), complex64
2025-10-23 21:28:48 - zarr_info - INFO - plot/rslc_pyramid/9.zarr zarray shape, chunks, dtype: (5, 4, 17), (256, 256, 1), complex64
2025-10-23 21:28:48 - zarr_info - INFO - plot/rslc_pyramid/10.zarr zarray shape, chunks, dtype: (3, 2, 17), (256, 256, 1), complex64
2025-10-23 21:28:48 - ras_pyramid - INFO - computing graph setted. doing all the computing.
2025-10-23 21:28:52 - ras_pyramid - INFO - computing finished. 3.0s
2025-10-23 21:28:52 - ras_pyramid - INFO - dask cluster closed.ras_plot
ras_plot (pyramid_dir:str, post_proc:Callable=None, n_kdim:int=None, bounds:tuple=None, level_increase=0)
plot rendered stack of ras tiles.
| Type | Default | Details | |
|---|---|---|---|
| pyramid_dir | str | directory to the rendered ras pyramid | |
| post_proc | Callable | None | function for the post processing, can be None, ‘intf_0’, ‘intf_seq’, ‘intf_all’ or user-defined function |
| n_kdim | int | None | number of key dimensions, can only be 0 or 1 or 2, ndim of raster dataset -2 by default |
| bounds | tuple | None | bounding box (x0, y0, x_max, y_max) |
| level_increase | int | 0 | amount of zoom level increase for more clear point show and faster responds time |
ras_plot take the rendered raster images as the input and return a Holoviews DynamicMap. It accept a post processing function for customized post processing and n_kdim to set number of kdims for returned DynamicMap.
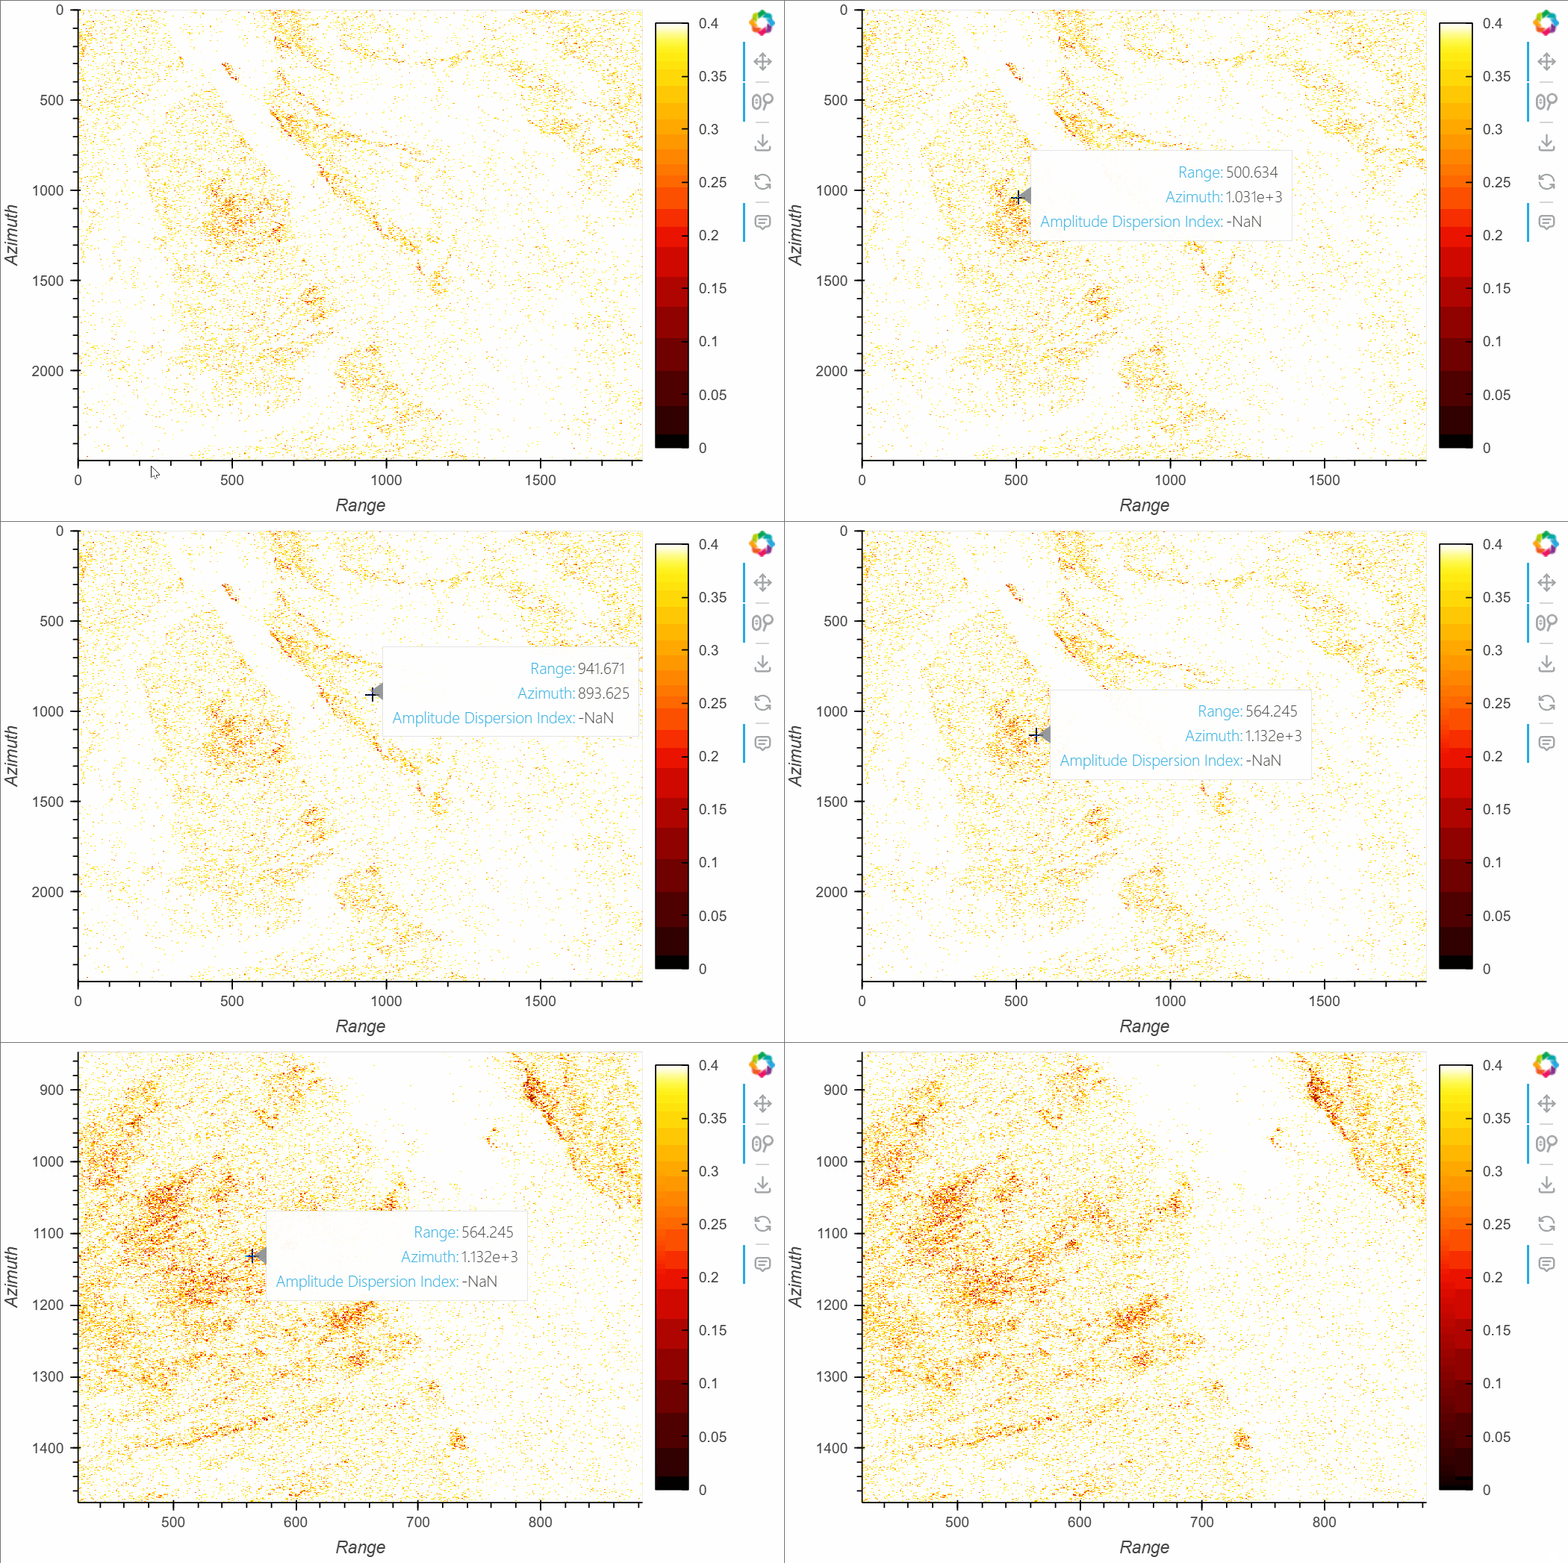
Here is an example to plot the amplitude dispersion index. We define a post processing function to mask pixels with ADI larger than 0.4:
def mask_adi(data_zarr,x_slice,y_slice,):
data = data_zarr[y_slice, x_slice]
data[data>=0.4]=np.nan
return dataNote that the first three arguments of post_proc_func have to be data_zarr, x_slice, y_slice.
adi_plot = ras_plot(adi_pyramid_dir,post_proc=mask_adi,bounds=(0,0,1833,2499),level_increase=1)Add annotations:
adi_plot = adi_plot.redim(x=hv.Dimension('r', label='Range'), y=hv.Dimension('az',label='Azimuth'),
z=hv.Dimension('adi',label='Amplitude Dispersion Index',range=(0,0.4)))Specify plotting options and plot:
adi_plot.opts(opts.Image(cmap='fire',width=600, height=400, colorbar=True,
invert_yaxis=True,
default_tools=['pan',WheelZoomTool(zoom_on_axis=False),'save','reset','hover'],
active_tools=['wheel_zoom']
))ras_plot can also take stack of raster images. It will return DynamicMap with keys. Here we define a function to generate interferograms with the first SLC as reference:
def intf_0(data_zarr, xslice, yslice,i):
return np.angle(data_zarr[yslice,xslice,0]*data_zarr[yslice,xslice,i].conj())intf_plot = ras_plot(rslc_pyramid_dir,post_proc=intf_0, level_increase=0)We have a set of convenient predefined post_proc functions, e.g., intf_0, intf_seq, intf_all. The above code equals to:
intf_plot = ras_plot(rslc_pyramid_dir,post_proc='intf_0', level_increase=0)Add annotations:
dates = ["20210802", "20210816", "20210830", "20210913", "20211011", "20211025", "20220606", "20220620",
"20220704", "20220718", "20220801", "20220815", "20220829", "20220912", "20220926", "20221010",
"20221024",]
intf_plot = intf_plot.redim(i=hv.Dimension('i', label='Interferogram', range=(0,16), value_format=(lambda i: dates[0]+'_'+dates[i])),
x=hv.Dimension('r', label='Range'), y=hv.Dimension('az',label='Azimuth'), z=hv.Dimension('Phase',range=(-np.pi,np.pi)))Specify plotting options and plot:
hv.output(widget_location='bottom')
intf_plot.opts(opts.Image(cmap='colorwheel',width=600, height=400, colorbar=True,
invert_yaxis=True,
default_tools=['pan',WheelZoomTool(zoom_on_axis=False),'save','reset','hover'],active_tools=['wheel_zoom']))#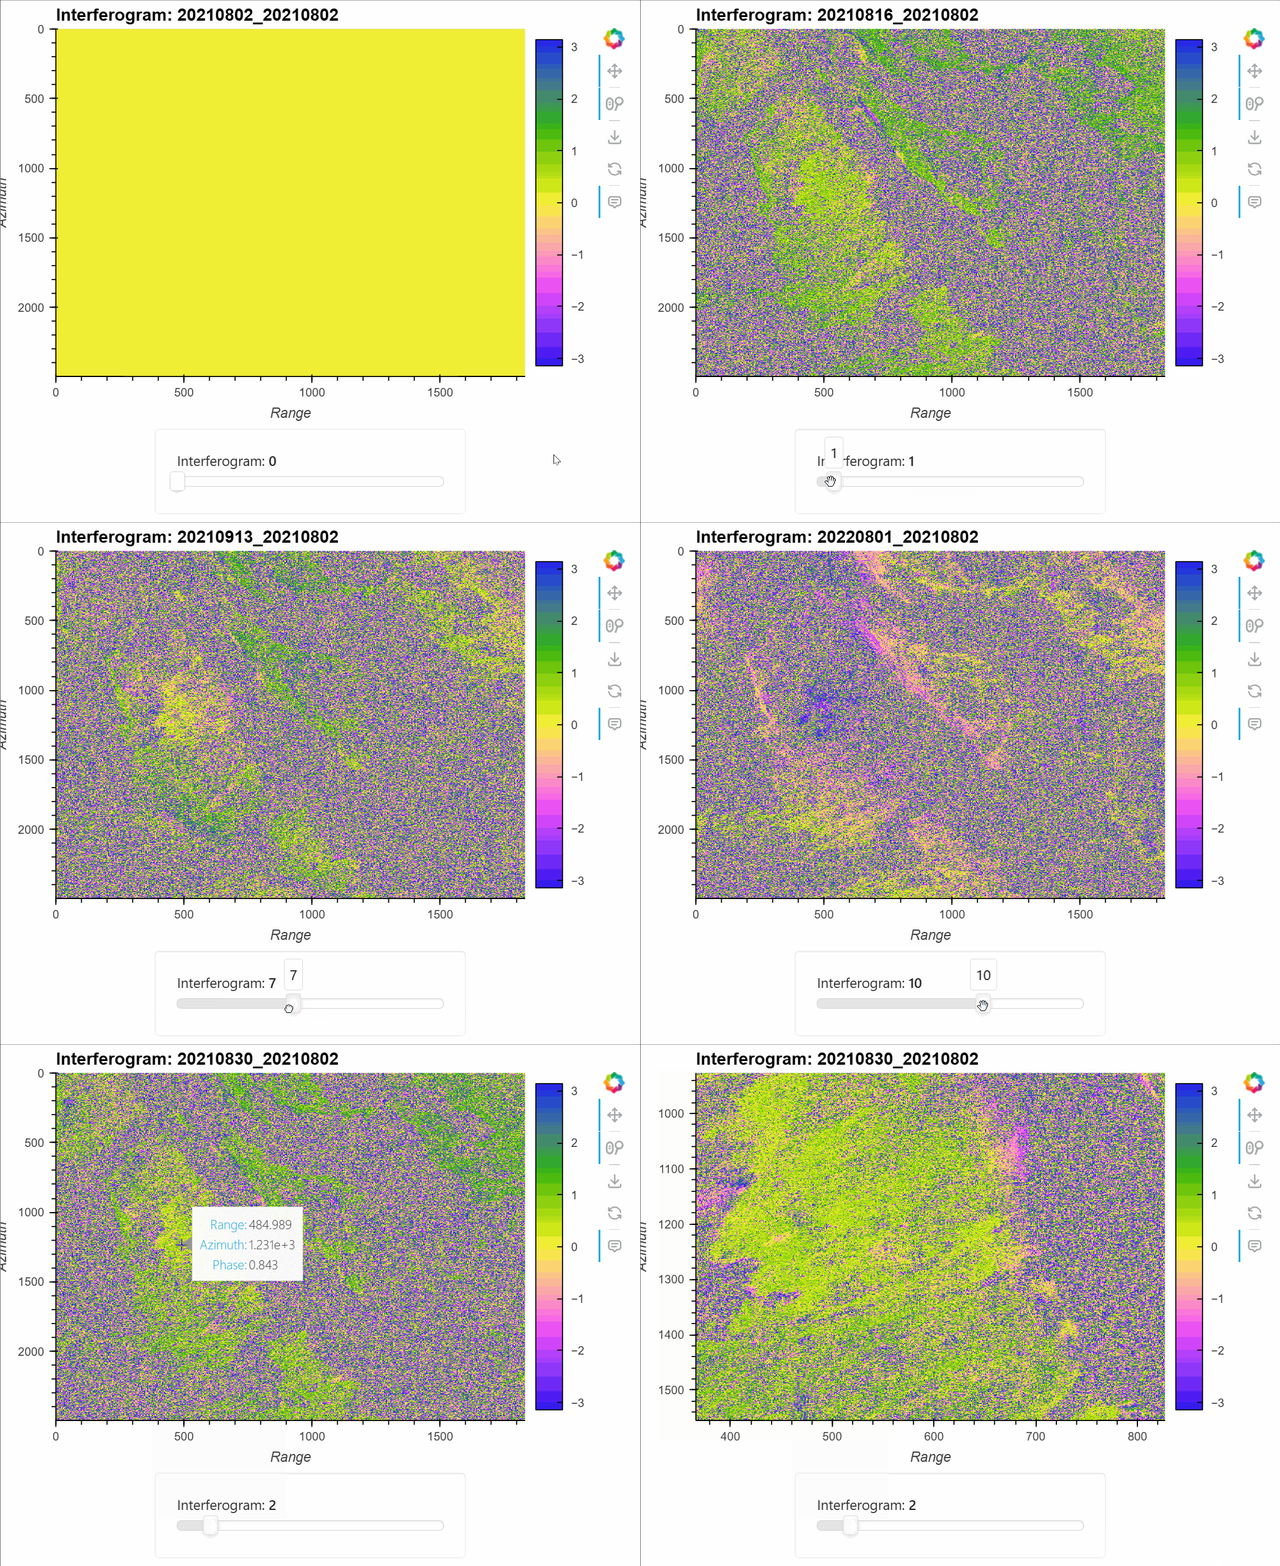Or the intensity:
def intensity(data_zarr, xslice, yslice,i):
return np.log(np.abs(data_zarr[yslice,xslice,i])**2)
int_plot = ras_plot(rslc_pyramid_dir,post_proc=intensity)
int_plot = int_plot.redim(i=hv.Dimension('i', label='Intensity', range=(1,16), value_format=(lambda i: dates[i])),
x=hv.Dimension('r', label='Range'), y=hv.Dimension('az',label='Azimuth'), z=hv.Dimension('Intensity'))
int_plot.opts(opts.Image(cmap='gray',width=600, height=600, colorbar=True,
invert_yaxis=True, default_tools=['pan',WheelZoomTool(zoom_on_axis=False),'save','reset','hover'],
active_tools=['wheel_zoom']))We can also plot sequential interferograms. In this case, we only plot 26 interferograms.
def intf_seq(data_zarr, xslice, yslice,i):
return np.angle(data_zarr[yslice,xslice,i]*data_zarr[yslice,xslice,i+1].conj())
intf_plot = ras_plot(rslc_pyramid_dir,post_proc=intf_seq)
# or
intf_plot = ras_plot(rslc_pyramid_dir,post_proc='intf_seq')
intf_plot = intf_plot.redim(i=hv.Dimension('i', label='Interferogram', range=(0,15), value_format=(lambda i: dates[i]+'_'+dates[i+1])),
x=hv.Dimension('r', label='Range'), y=hv.Dimension('az',label='Azimuth'), z=hv.Dimension('Phase',range=(-np.pi,np.pi)))
intf_plot.opts(opts.Image(cmap='colorwheel',width=600, height=600, colorbar=True,
invert_yaxis=True, default_tools=['pan',WheelZoomTool(zoom_on_axis=False),'save','reset','hover'],
active_tools=['wheel_zoom']))The n_kdim don’t have to be data.ndim-2. Here is an example to show all interferograms.
def intf_all(data_zarr, xslice, yslice,i,j): # we have 2 kdims here
return np.angle(data_zarr[yslice,xslice,i]*data_zarr[yslice,xslice,j].conj())intf_plot = ras_plot(rslc_pyramid_dir,post_proc=intf_all,n_kdim=2,level_increase=0)
# or
intf_plot = ras_plot(rslc_pyramid_dir,post_proc='intf_all',n_kdim=2,level_increase=0)Add annotations:
intf_plot = intf_plot.redim(i=hv.Dimension('i', label='Reference Image', range=(0,16), value_format=(lambda i: dates[i])),
j=hv.Dimension('j', label='Secondary Image', range=(0,16), value_format=(lambda i: dates[i])),
x=hv.Dimension('r', label='Range'), y=hv.Dimension('az',label='Azimuth'), z=hv.Dimension('Phase',range=(-np.pi,np.pi)))Specify plotting options and plot:
hv.output(widget_location='bottom')
intf_plot.opts(opts.Image(cmap='colorwheel',frame_width=500, frame_height=600, colorbar=True,
invert_yaxis=True,
default_tools=['pan',WheelZoomTool(zoom_on_axis=False),'save','reset','hover'],active_tools=['wheel_zoom']))point cloud plot
pc_pyramid
pc_pyramid (pc:str, out_dir:str, x:str=None, y:str=None, yx:str=None, ras_resolution:float=20, ras_chunks:tuple[int,int]=(256, 256), pc_chunks:int=65536, processes=False, n_workers=1, threads_per_worker=2, **dask_cluster_arg)
render point cloud data to pyramid of difference zoom levels.
| Type | Default | Details | |
|---|---|---|---|
| pc | str | path to point cloud data, 1D array (one single pc image) or 2D zarr array (a stack of pc images) | |
| out_dir | str | output directory to store rendered data | |
| x | str | None | path to x coordinate, e.g., longitude or web mercator x |
| y | str | None | path to y coordinate, e.g., latitude or web mercator y |
| yx | str | None | path to x and y coordinates. this coordinates should have shape [n_points,2]. e.g., gix |
| ras_resolution | float | 20 | minimum resolution of rendered raster data, |
| ras_chunks | tuple | (256, 256) | output raster tile size |
| pc_chunks | int | 65536 | output pc tile size |
| processes | bool | False | use process for dask worker over thread |
| n_workers | int | 1 | number of dask worker |
| threads_per_worker | int | 2 | number of threads per dask worker |
| dask_cluster_arg | VAR_KEYWORD |
pc_pyramid is a little bit more complex than ras_pyramid. The zoom level -1 is the point cloud data. From zoom level 0 to above, the point cloud data is rasterize at different resolution. ras_resolution is the parameter to set the resolution of zoom level 0.
ps_can_adi = 'ps/ps_can_adi.zarr/'
ps_can_rslc = 'ps/ps_can_rslc.zarr/'
ps_can_x = './ps/ps_can_e.zarr/'
ps_can_y = './ps/ps_can_n.zarr/'
adi_pyramid_dir = 'plot/pc/adi_pyramid'
rslc_pyramid_dir = 'plot/pc/rslc_pyramid'pc_pyramid(ps_can_adi, adi_pyramid_dir, x=ps_can_x, y=ps_can_y, ras_resolution=20)2025-10-23 21:28:55 - log_args - INFO - running function: pc_pyramid
2025-10-23 21:28:55 - log_args - INFO - fetching args:
2025-10-23 21:28:55 - log_args - INFO - pc = 'ps/ps_can_adi.zarr/'
2025-10-23 21:28:55 - log_args - INFO - out_dir = 'plot/pc/adi_pyramid'
2025-10-23 21:28:55 - log_args - INFO - x = './ps/ps_can_e.zarr/'
2025-10-23 21:28:55 - log_args - INFO - y = './ps/ps_can_n.zarr/'
2025-10-23 21:28:55 - log_args - INFO - yx = None
2025-10-23 21:28:55 - log_args - INFO - ras_resolution = 20
2025-10-23 21:28:55 - log_args - INFO - ras_chunks = (256, 256)
2025-10-23 21:28:55 - log_args - INFO - pc_chunks = 65536
2025-10-23 21:28:55 - log_args - INFO - processes = False
2025-10-23 21:28:55 - log_args - INFO - n_workers = 1
2025-10-23 21:28:55 - log_args - INFO - threads_per_worker = 2
2025-10-23 21:28:55 - log_args - INFO - dask_cluster_arg = {}
2025-10-23 21:28:55 - log_args - INFO - fetching args done.
2025-10-23 21:28:55 - pc_pyramid - INFO - clean out dir
2025-10-23 21:28:56 - zarr_info - INFO - ps/ps_can_adi.zarr/ zarray shape, chunks, dtype: (43201,), (100000,), float32
2025-10-23 21:28:56 - pc_pyramid - INFO - rendering point cloud data coordinates:
2025-10-23 21:28:56 - pc_pyramid - INFO - rasterizing point cloud data to grid with bounds: [np.float64(-16498455.50940282), np.float64(8649634.094942318), np.float64(-16470215.50940282), np.float64(8674894.094942318)].
2025-10-23 21:28:56 - zarr_info - INFO - plot/pc/adi_pyramid/x.zarr zarray shape, chunks, dtype: (43201,), (65536,), float64
2025-10-23 21:28:56 - zarr_info - INFO - plot/pc/adi_pyramid/y.zarr zarray shape, chunks, dtype: (43201,), (65536,), float64
2025-10-23 21:28:56 - pc_pyramid - INFO - pc data coordinates rendering ends.
2025-10-23 21:28:56 - zarr_info - INFO - plot/pc/adi_pyramid/idx_0.zarr zarray shape, chunks, dtype: (1264, 1413), (256, 256), int64
2025-10-23 21:28:56 - zarr_info - INFO - plot/pc/adi_pyramid/idx_1.zarr zarray shape, chunks, dtype: (632, 707), (256, 256), int64
2025-10-23 21:28:56 - zarr_info - INFO - plot/pc/adi_pyramid/idx_2.zarr zarray shape, chunks, dtype: (316, 354), (256, 256), int64
2025-10-23 21:28:56 - zarr_info - INFO - plot/pc/adi_pyramid/idx_3.zarr zarray shape, chunks, dtype: (158, 177), (256, 256), int64
2025-10-23 21:28:56 - zarr_info - INFO - plot/pc/adi_pyramid/idx_4.zarr zarray shape, chunks, dtype: (79, 89), (256, 256), int64
2025-10-23 21:28:56 - zarr_info - INFO - plot/pc/adi_pyramid/idx_5.zarr zarray shape, chunks, dtype: (40, 45), (256, 256), int64
2025-10-23 21:28:56 - zarr_info - INFO - plot/pc/adi_pyramid/idx_6.zarr zarray shape, chunks, dtype: (20, 23), (256, 256), int64
2025-10-23 21:28:56 - zarr_info - INFO - plot/pc/adi_pyramid/idx_7.zarr zarray shape, chunks, dtype: (10, 12), (256, 256), int64
2025-10-23 21:28:56 - zarr_info - INFO - plot/pc/adi_pyramid/idx_8.zarr zarray shape, chunks, dtype: (5, 6), (256, 256), int64
2025-10-23 21:28:56 - zarr_info - INFO - plot/pc/adi_pyramid/idx_9.zarr zarray shape, chunks, dtype: (3, 3), (256, 256), int64
2025-10-23 21:28:56 - zarr_info - INFO - plot/pc/adi_pyramid/idx_10.zarr zarray shape, chunks, dtype: (2, 2), (256, 256), int64
2025-10-23 21:28:56 - pc_pyramid - INFO - rasterized idx rendering ends
2025-10-23 21:28:56 - pc_pyramid - INFO - dask local cluster started to render pc data.
2025-10-23 21:28:56 - dask_cluster_info - INFO - dask cluster: LocalCluster(dashboard_link='http://10.211.48.7:8787/status', workers=1, threads=2, memory=256.00 GiB)
2025-10-23 21:28:56 - zarr_info - INFO - plot/pc/adi_pyramid/pc.zarr zarray shape, chunks, dtype: (43201,), (65536,), float32
2025-10-23 21:28:56 - zarr_info - INFO - plot/pc/adi_pyramid/0.zarr zarray shape, chunks, dtype: (1264, 1413), (256, 256), float32
2025-10-23 21:28:56 - zarr_info - INFO - plot/pc/adi_pyramid/1.zarr zarray shape, chunks, dtype: (632, 707), (256, 256), float32
2025-10-23 21:28:56 - zarr_info - INFO - plot/pc/adi_pyramid/2.zarr zarray shape, chunks, dtype: (316, 354), (256, 256), float32
2025-10-23 21:28:56 - zarr_info - INFO - plot/pc/adi_pyramid/3.zarr zarray shape, chunks, dtype: (158, 177), (256, 256), float32
2025-10-23 21:28:56 - zarr_info - INFO - plot/pc/adi_pyramid/4.zarr zarray shape, chunks, dtype: (79, 89), (256, 256), float32
2025-10-23 21:28:56 - zarr_info - INFO - plot/pc/adi_pyramid/5.zarr zarray shape, chunks, dtype: (40, 45), (256, 256), float32
2025-10-23 21:28:56 - zarr_info - INFO - plot/pc/adi_pyramid/6.zarr zarray shape, chunks, dtype: (20, 23), (256, 256), float32
2025-10-23 21:28:56 - zarr_info - INFO - plot/pc/adi_pyramid/7.zarr zarray shape, chunks, dtype: (10, 12), (256, 256), float32
2025-10-23 21:28:56 - zarr_info - INFO - plot/pc/adi_pyramid/8.zarr zarray shape, chunks, dtype: (5, 6), (256, 256), float32
2025-10-23 21:28:56 - zarr_info - INFO - plot/pc/adi_pyramid/9.zarr zarray shape, chunks, dtype: (3, 3), (256, 256), float32
2025-10-23 21:28:56 - zarr_info - INFO - plot/pc/adi_pyramid/10.zarr zarray shape, chunks, dtype: (2, 2), (256, 256), float32
2025-10-23 21:28:56 - pc_pyramid - INFO - computing graph setted. doing all the computing.
2025-10-23 21:28:56 - pc_pyramid - INFO - computing finished. 0.1s
2025-10-23 21:28:56 - pc_pyramid - INFO - dask cluster closed.
CPU times: user 1.76 s, sys: 1.61 s, total: 3.37 s
Wall time: 1.01 spc_pyramid(ps_can_rslc, rslc_pyramid_dir, x=ps_can_x, y=ps_can_y, ras_resolution=20)2025-10-23 21:28:56 - log_args - INFO - running function: pc_pyramid
2025-10-23 21:28:56 - log_args - INFO - fetching args:
2025-10-23 21:28:56 - log_args - INFO - pc = 'ps/ps_can_rslc.zarr/'
2025-10-23 21:28:57 - log_args - INFO - out_dir = 'plot/pc/rslc_pyramid'
2025-10-23 21:28:57 - log_args - INFO - x = './ps/ps_can_e.zarr/'
2025-10-23 21:28:57 - log_args - INFO - y = './ps/ps_can_n.zarr/'
2025-10-23 21:28:57 - log_args - INFO - yx = None
2025-10-23 21:28:57 - log_args - INFO - ras_resolution = 20
2025-10-23 21:28:57 - log_args - INFO - ras_chunks = (256, 256)
2025-10-23 21:28:57 - log_args - INFO - pc_chunks = 65536
2025-10-23 21:28:57 - log_args - INFO - processes = False
2025-10-23 21:28:57 - log_args - INFO - n_workers = 1
2025-10-23 21:28:57 - log_args - INFO - threads_per_worker = 2
2025-10-23 21:28:57 - log_args - INFO - dask_cluster_arg = {}
2025-10-23 21:28:57 - log_args - INFO - fetching args done.
2025-10-23 21:28:57 - pc_pyramid - INFO - clean out dir
2025-10-23 21:28:57 - zarr_info - INFO - ps/ps_can_rslc.zarr/ zarray shape, chunks, dtype: (43201, 17), (100000, 1), complex64
2025-10-23 21:28:57 - pc_pyramid - INFO - rendering point cloud data coordinates:
2025-10-23 21:28:57 - pc_pyramid - INFO - rasterizing point cloud data to grid with bounds: [np.float64(-16498455.50940282), np.float64(8649634.094942318), np.float64(-16470215.50940282), np.float64(8674894.094942318)].
2025-10-23 21:28:57 - zarr_info - INFO - plot/pc/rslc_pyramid/x.zarr zarray shape, chunks, dtype: (43201,), (65536,), float64
2025-10-23 21:28:57 - zarr_info - INFO - plot/pc/rslc_pyramid/y.zarr zarray shape, chunks, dtype: (43201,), (65536,), float64
2025-10-23 21:28:57 - pc_pyramid - INFO - pc data coordinates rendering ends.
2025-10-23 21:28:57 - zarr_info - INFO - plot/pc/rslc_pyramid/idx_0.zarr zarray shape, chunks, dtype: (1264, 1413), (256, 256), int64
2025-10-23 21:28:57 - zarr_info - INFO - plot/pc/rslc_pyramid/idx_1.zarr zarray shape, chunks, dtype: (632, 707), (256, 256), int64
2025-10-23 21:28:57 - zarr_info - INFO - plot/pc/rslc_pyramid/idx_2.zarr zarray shape, chunks, dtype: (316, 354), (256, 256), int64
2025-10-23 21:28:57 - zarr_info - INFO - plot/pc/rslc_pyramid/idx_3.zarr zarray shape, chunks, dtype: (158, 177), (256, 256), int64
2025-10-23 21:28:57 - zarr_info - INFO - plot/pc/rslc_pyramid/idx_4.zarr zarray shape, chunks, dtype: (79, 89), (256, 256), int64
2025-10-23 21:28:57 - zarr_info - INFO - plot/pc/rslc_pyramid/idx_5.zarr zarray shape, chunks, dtype: (40, 45), (256, 256), int64
2025-10-23 21:28:57 - zarr_info - INFO - plot/pc/rslc_pyramid/idx_6.zarr zarray shape, chunks, dtype: (20, 23), (256, 256), int64
2025-10-23 21:28:57 - zarr_info - INFO - plot/pc/rslc_pyramid/idx_7.zarr zarray shape, chunks, dtype: (10, 12), (256, 256), int64
2025-10-23 21:28:57 - zarr_info - INFO - plot/pc/rslc_pyramid/idx_8.zarr zarray shape, chunks, dtype: (5, 6), (256, 256), int64
2025-10-23 21:28:57 - zarr_info - INFO - plot/pc/rslc_pyramid/idx_9.zarr zarray shape, chunks, dtype: (3, 3), (256, 256), int64
2025-10-23 21:28:57 - zarr_info - INFO - plot/pc/rslc_pyramid/idx_10.zarr zarray shape, chunks, dtype: (2, 2), (256, 256), int64
2025-10-23 21:28:57 - pc_pyramid - INFO - rasterized idx rendering ends
2025-10-23 21:28:57 - pc_pyramid - INFO - dask local cluster started to render pc data.
2025-10-23 21:28:57 - dask_cluster_info - INFO - dask cluster: LocalCluster(dashboard_link='http://10.211.48.7:8787/status', workers=1, threads=2, memory=256.00 GiB)
2025-10-23 21:28:57 - zarr_info - INFO - plot/pc/rslc_pyramid/pc.zarr zarray shape, chunks, dtype: (43201, 17), (65536, 1), complex64
2025-10-23 21:28:57 - zarr_info - INFO - plot/pc/rslc_pyramid/0.zarr zarray shape, chunks, dtype: (1264, 1413, 17), (256, 256, 1), complex64
2025-10-23 21:28:57 - zarr_info - INFO - plot/pc/rslc_pyramid/1.zarr zarray shape, chunks, dtype: (632, 707, 17), (256, 256, 1), complex64
2025-10-23 21:28:57 - zarr_info - INFO - plot/pc/rslc_pyramid/2.zarr zarray shape, chunks, dtype: (316, 354, 17), (256, 256, 1), complex64
2025-10-23 21:28:57 - zarr_info - INFO - plot/pc/rslc_pyramid/3.zarr zarray shape, chunks, dtype: (158, 177, 17), (256, 256, 1), complex64
2025-10-23 21:28:57 - zarr_info - INFO - plot/pc/rslc_pyramid/4.zarr zarray shape, chunks, dtype: (79, 89, 17), (256, 256, 1), complex64
2025-10-23 21:28:57 - zarr_info - INFO - plot/pc/rslc_pyramid/5.zarr zarray shape, chunks, dtype: (40, 45, 17), (256, 256, 1), complex64
2025-10-23 21:28:58 - zarr_info - INFO - plot/pc/rslc_pyramid/6.zarr zarray shape, chunks, dtype: (20, 23, 17), (256, 256, 1), complex64
2025-10-23 21:28:58 - zarr_info - INFO - plot/pc/rslc_pyramid/7.zarr zarray shape, chunks, dtype: (10, 12, 17), (256, 256, 1), complex64
2025-10-23 21:28:58 - zarr_info - INFO - plot/pc/rslc_pyramid/8.zarr zarray shape, chunks, dtype: (5, 6, 17), (256, 256, 1), complex64
2025-10-23 21:28:58 - zarr_info - INFO - plot/pc/rslc_pyramid/9.zarr zarray shape, chunks, dtype: (3, 3, 17), (256, 256, 1), complex64
2025-10-23 21:28:58 - zarr_info - INFO - plot/pc/rslc_pyramid/10.zarr zarray shape, chunks, dtype: (2, 2, 17), (256, 256, 1), complex64
2025-10-23 21:28:58 - pc_pyramid - INFO - computing graph setted. doing all the computing.
2025-10-23 21:28:59 - pc_pyramid - INFO - computing finished. 1.3s
2025-10-23 21:28:59 - pc_pyramid - INFO - dask cluster closed.
CPU times: user 4.4 s, sys: 1.6 s, total: 6.01 s
Wall time: 2.69 spc_plot
pc_plot (pyramid_dir:str, post_proc_ras:Callable=None, post_proc_pc:Callable=None, n_kdim:int=None, rtree=None, level_increase=0)
plot rendered point cloud pyramid.
| Type | Default | Details | |
|---|---|---|---|
| pyramid_dir | str | directory to the rendered point cloud pyramid | |
| post_proc_ras | Callable | None | function for the post processing |
| post_proc_pc | Callable | None | function for the post processing |
| n_kdim | int | None | number of key dimensions, can only be 0 or 1 or 2, ndim of point cloud dataset -1 by default |
| rtree | NoneType | None | rtree, if not provide, will be automatically generated but may slow the program |
| level_increase | int | 0 | amount of zoom level increase for more clear point show and faster responds time |
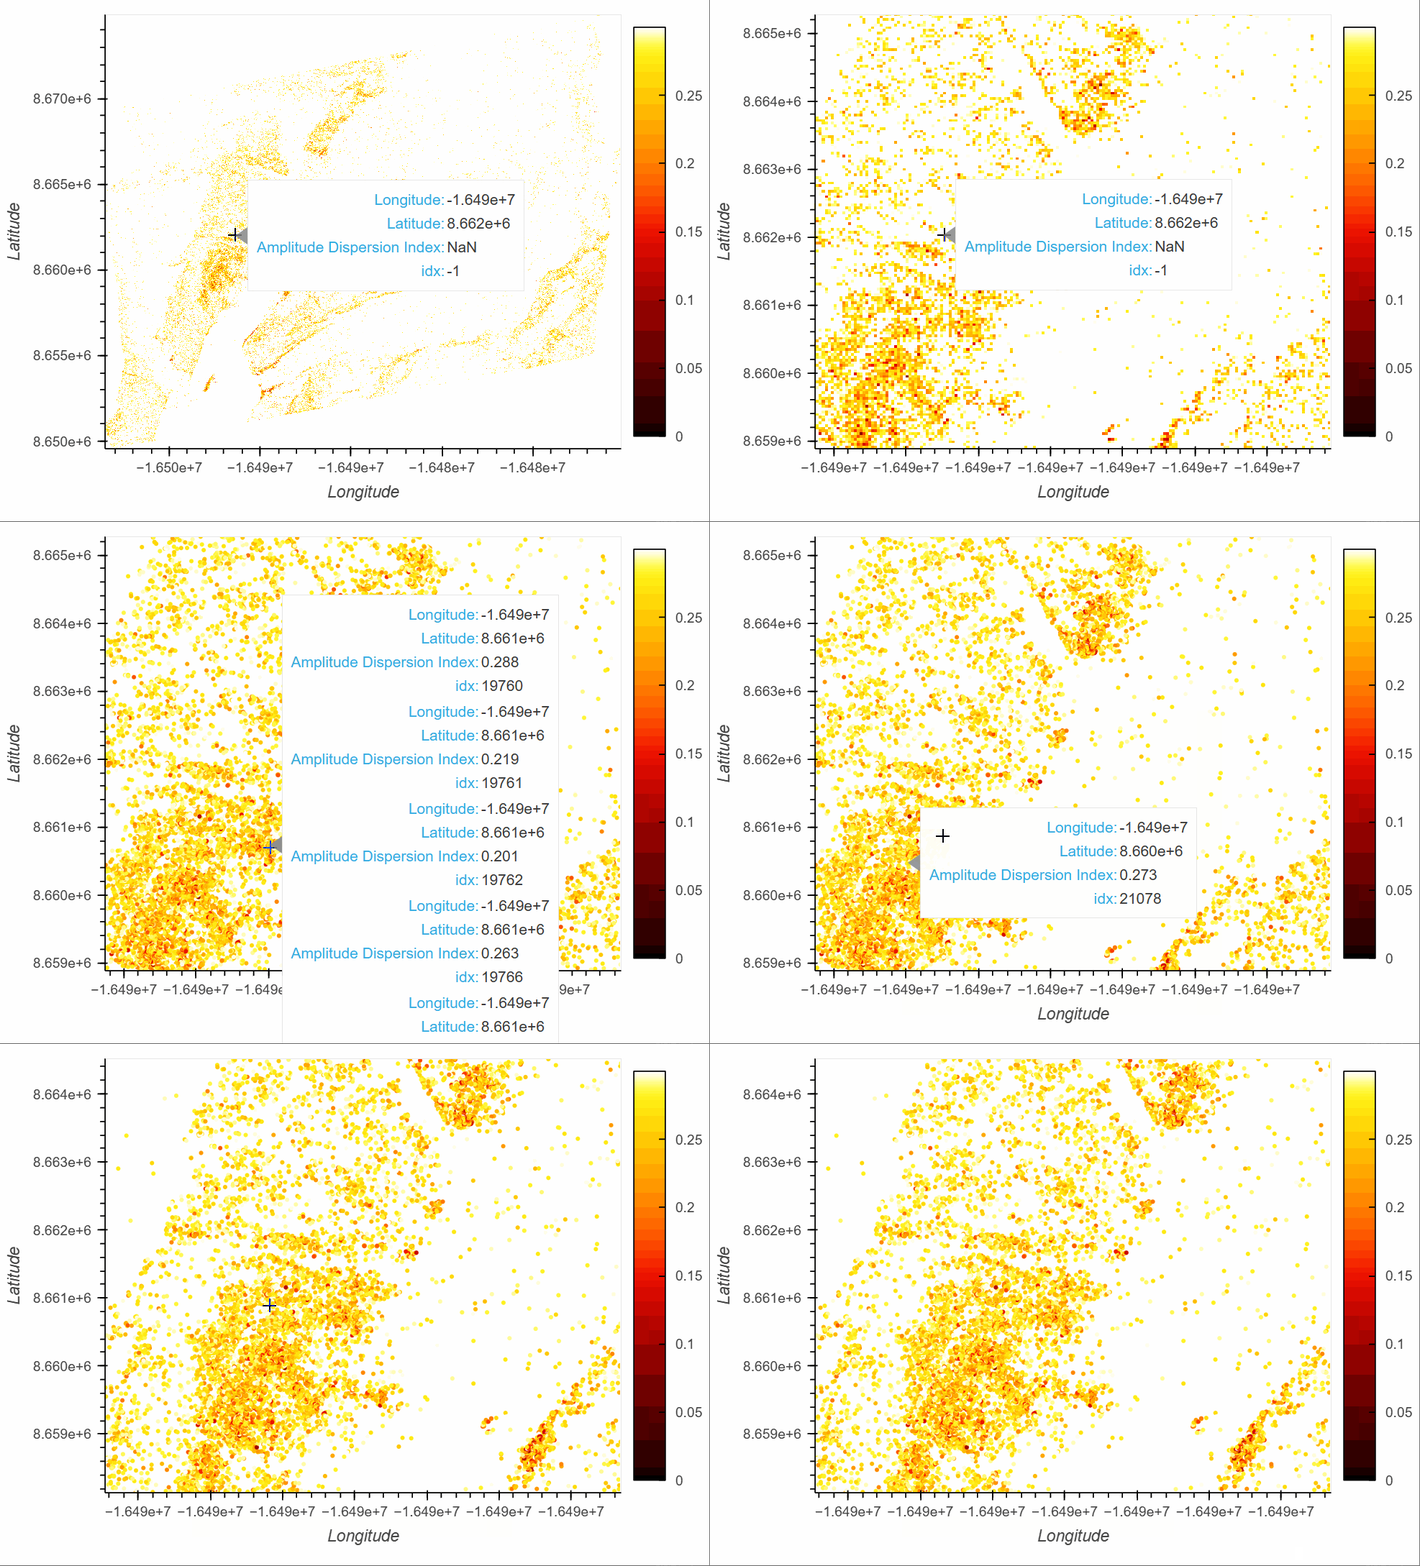
pc_plot take the rendered point cloud dataset as the input and return a Holoviews DynamicMap. When the zoom level is -1, it plot the the raw point cloud data. When the zoom level is 0 or over 0, it plot the rasterized images. Just as ras_plot, it accept post processing functions for both point cloud data and raster data to be plot. It is the user’s duty to esure the post processing fuctions coincide with each other. It also accept n_kdim to set number of kdims for returned DynamicMap.
Here is an example to plot the amplitude dispersion index:
adi_ras_plot, adi_pc_plot = pc_plot(adi_pyramid_dir,level_increase=1)
adi_plot = adi_ras_plot*adi_pc_plotAdd annotations:
adi_plot = adi_plot.redim(x=hv.Dimension('lon', label='Longitude'), y=hv.Dimension('lat',label='Latitude'),
z=hv.Dimension('adi',label='Amplitude Dispersion Index')
)Specify plotting options and plot:
adi_plot.opts(opts.Image(cmap='fire',width=600, height=400, colorbar=True,
clim = (0,0.3),
default_tools=['pan',WheelZoomTool(zoom_on_axis=False),'save','reset','hover'],
active_tools=['wheel_zoom']
),
opts.Points(color='adi', cmap='fire',width=600, height=400, colorbar=True,
clim = (0,0.3),
default_tools=['pan',WheelZoomTool(zoom_on_axis=False),'save','reset','hover'],
active_tools=['wheel_zoom']
)
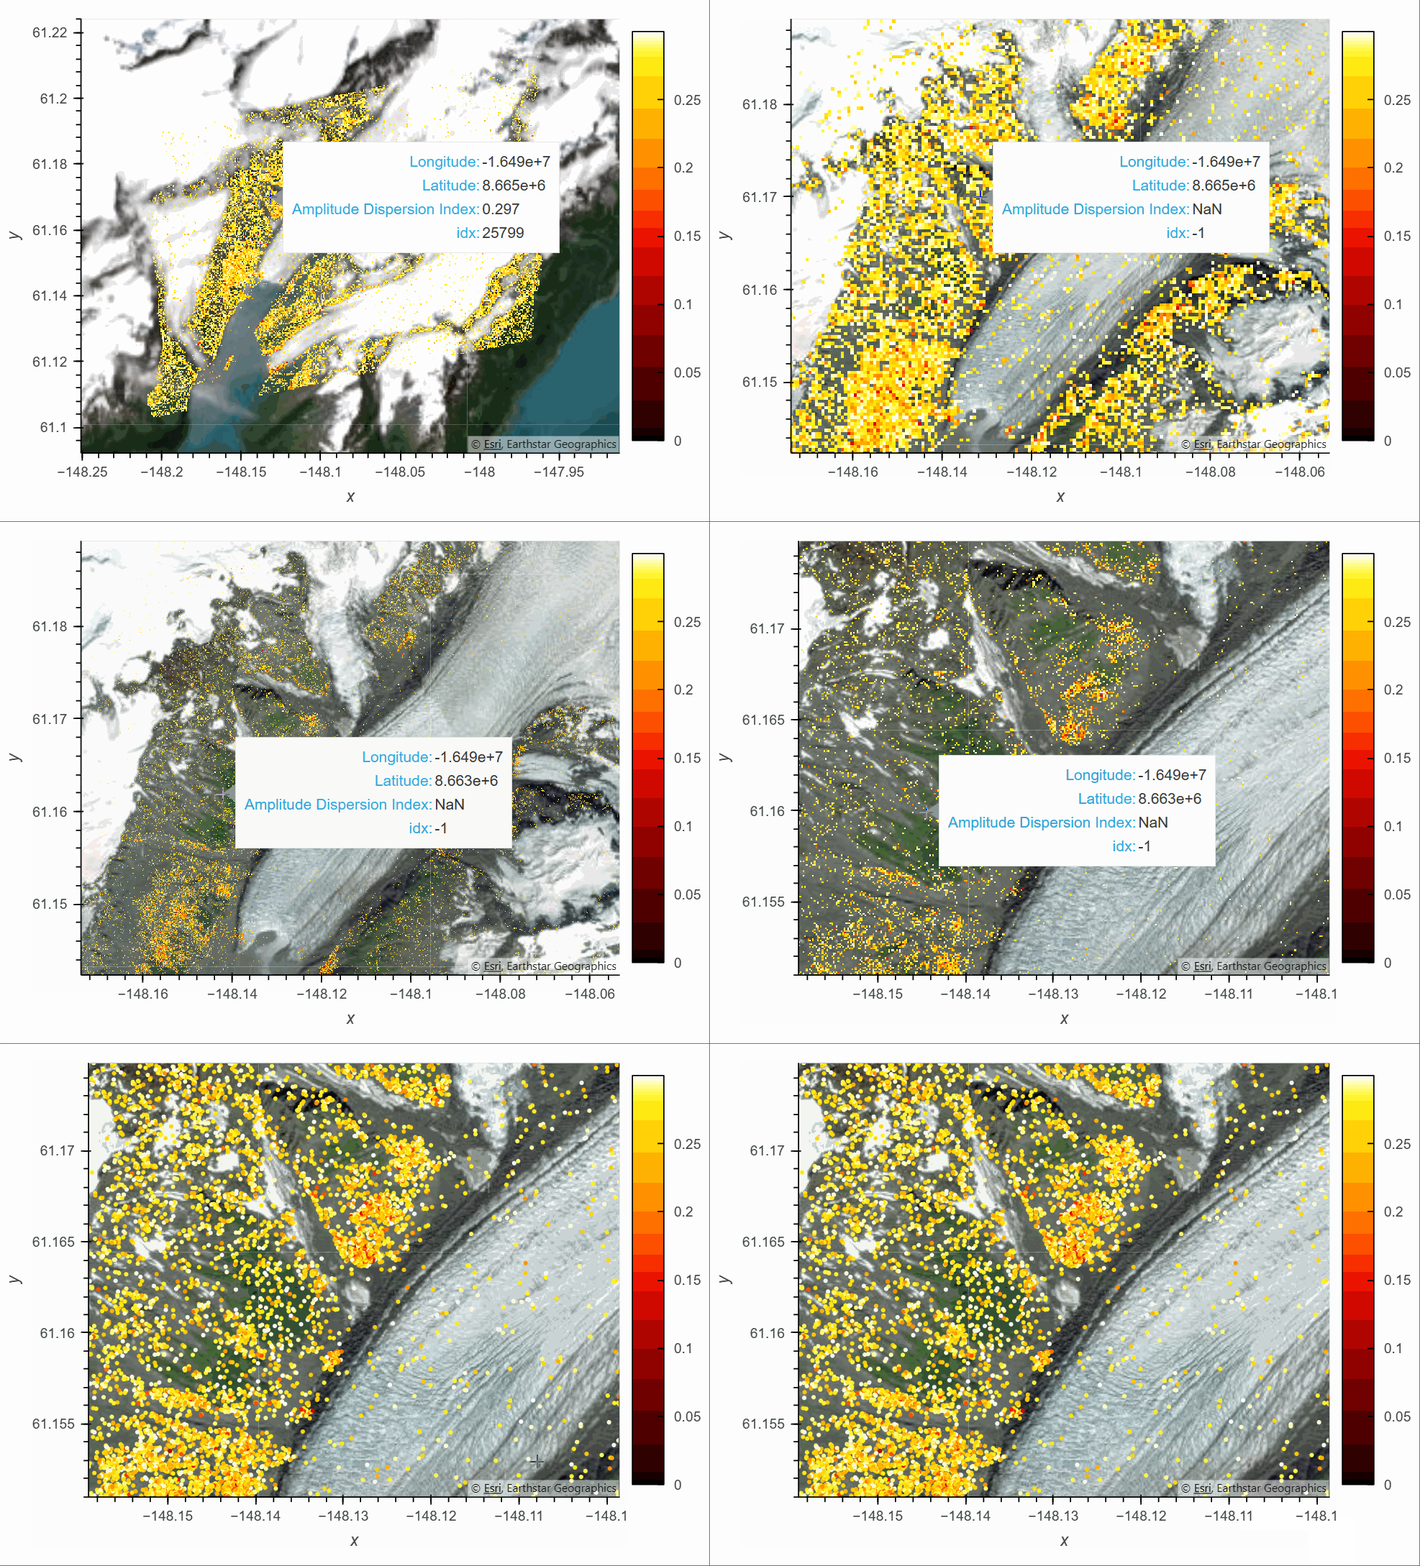
)Add the optical image as the background:
hv.element.tiles.EsriImagery()*adi_plotNote that, for displaying data over tiles, the data have to be projected to the Web Mercator Projection.
As ras_plot, pc_plot can also take stack of point cloud dataset. It will return DynamicMap with keys. Here we define a function to generate interferograms with the first SLC as reference:
def intf_0_pc(data_zarr,idx_array,i):
return np.angle(data_zarr[idx_array,0]*data_zarr[idx_array,i].conj())
def intf_0_ras(data_zarr, xslice, yslice,i):
return np.angle(data_zarr[yslice,xslice,0]*data_zarr[yslice,xslice,i].conj())intf_ras_plot, intf_pc_plot = pc_plot(rslc_pyramid_dir,post_proc_ras=intf_0_ras, post_proc_pc=intf_0_pc, level_increase=1)
# or
intf_ras_plot, intf_pc_plot = pc_plot(rslc_pyramid_dir,post_proc_ras='intf_0', post_proc_pc='intf_0', level_increase=1)
intf_plot = intf_ras_plot*intf_pc_plotAdd annotations:
dates = ["20210802", "20210816", "20210830", "20210913", "20211011", "20211025", "20220606", "20220620",
"20220704", "20220718", "20220801", "20220815", "20220829", "20220912", "20220926", "20221010",
"20221024",]
intf_plot = intf_plot.redim(i=hv.Dimension('i', label='Interferogram', range=(0,16), value_format=(lambda i: dates[0]+'_'+dates[i])),
x=hv.Dimension('lon', label='Longitude'), y=hv.Dimension('lat',label='Latitude'), z=hv.Dimension('Phase',range=(-np.pi,np.pi)))Specify plotting options and plot:
hv.output(widget_location='bottom')
intf_plot.opts(opts.Image(cmap='colorwheel',width=600, height=400, colorbar=True,
default_tools=['pan',WheelZoomTool(zoom_on_axis=False),'save','reset','hover'],
active_tools=['wheel_zoom']
),
opts.Points(color='Phase', cmap='colorwheel',width=600, height=400, colorbar=True,
# invert_yaxis=True,
default_tools=['pan',WheelZoomTool(zoom_on_axis=False),'save','reset','hover'],
active_tools=['wheel_zoom']
)
)#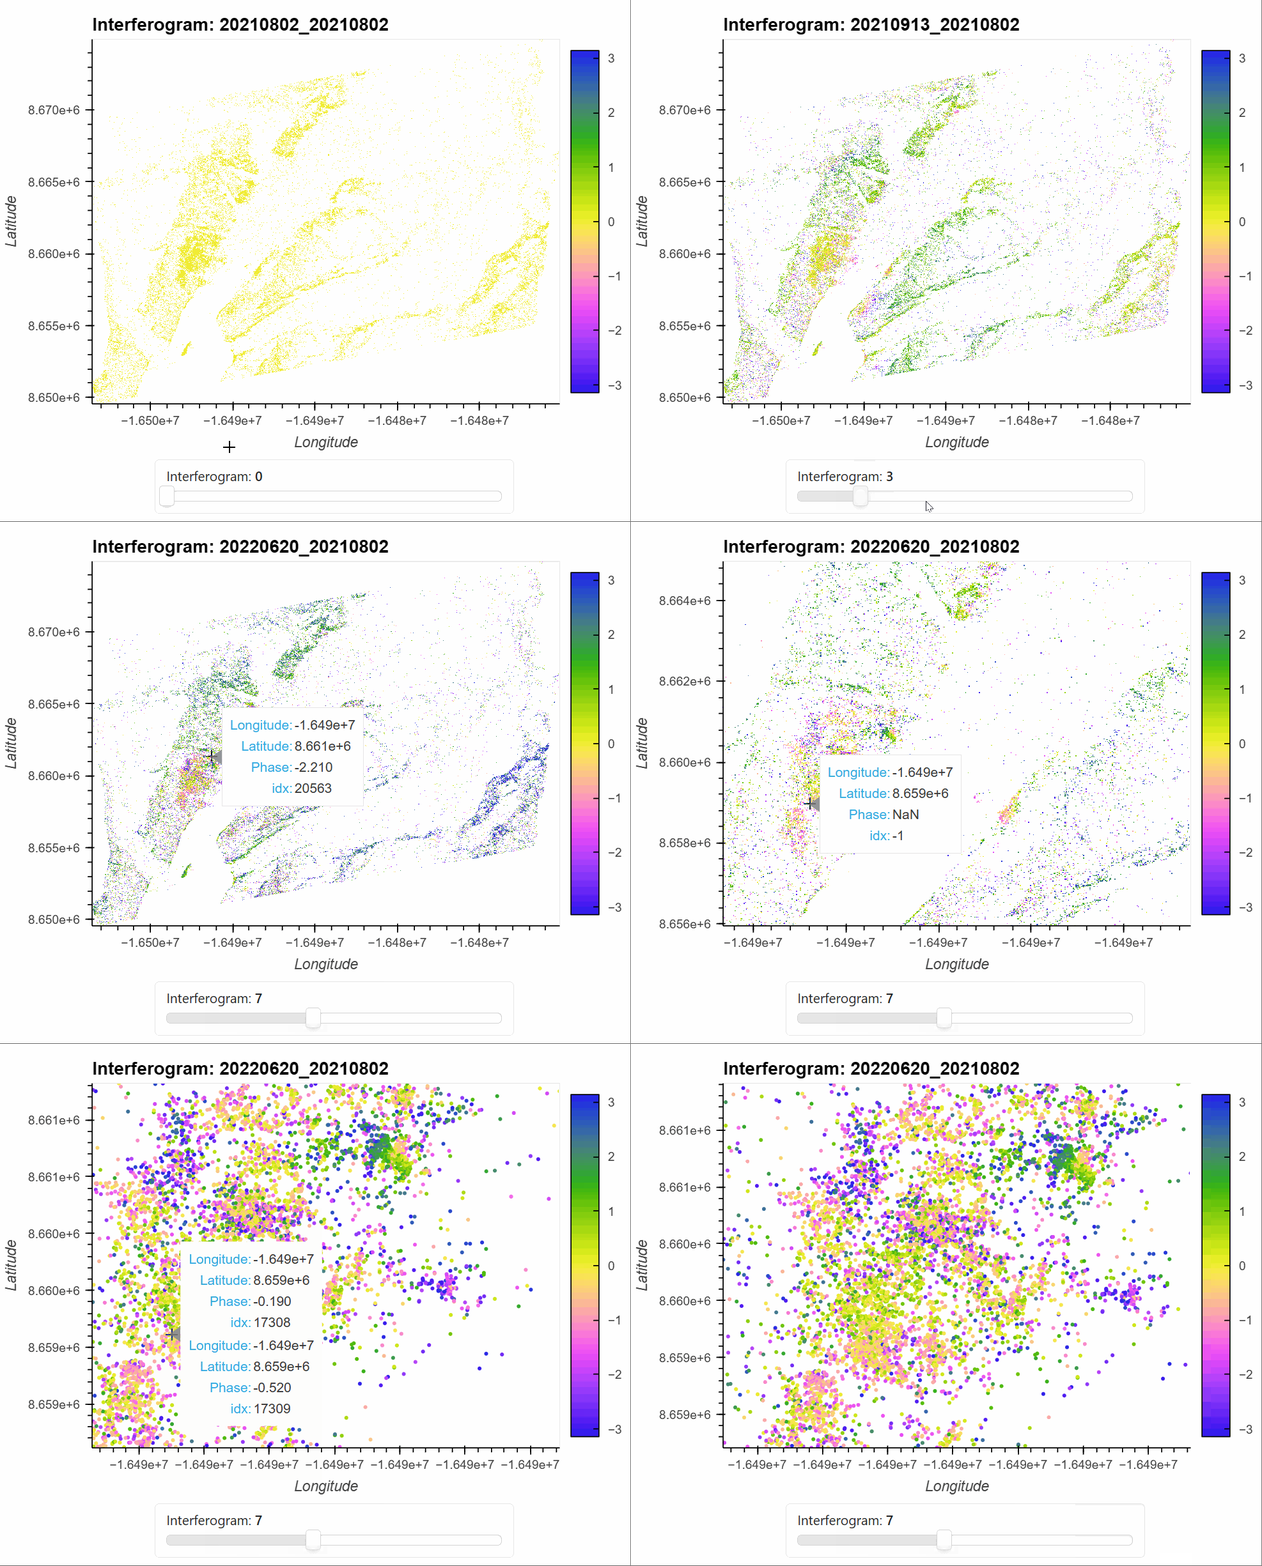The n_kdim don’t have to be data.ndim-1. Here is an example to show all interferograms.
def intf_pc(data_zarr, idx_arr,i,j): # we have 2 kdims here
return np.angle(data_zarr[idx_arr,i]*data_zarr[idx_arr,j].conj())
def intf_ras(data_zarr, xslice, yslice,i,j): # we have 2 kdims here
return np.angle(data_zarr[yslice,xslice,i]*data_zarr[yslice,xslice,j].conj())intf_ras_plot, intf_pc_plot = pc_plot(rslc_pyramid_dir,post_proc_ras=intf_ras, post_proc_pc=intf_pc,n_kdim=2,level_increase=0)
# or
intf_ras_plot, intf_pc_plot = pc_plot(rslc_pyramid_dir,post_proc_ras='intf_all', post_proc_pc='intf_all',n_kdim=2,level_increase=0)
intf_plot = intf_ras_plot*intf_pc_plotAdd annotations:
intf_plot = intf_plot.redim(i=hv.Dimension('i', label='Reference Image', range=(0,16), value_format=(lambda i: dates[i])),
j=hv.Dimension('j', label='Secondary Image', range=(0,16), value_format=(lambda i: dates[i])),
x=hv.Dimension('r', label='Range'), y=hv.Dimension('az',label='Azimuth'), z=hv.Dimension('Phase',range=(-np.pi,np.pi)))Specify plotting options and plot:
hv.output(widget_location='bottom')
intf_plot.opts(opts.Image(cmap='colorwheel',width=600, height=400, colorbar=False,
default_tools=['pan',WheelZoomTool(zoom_on_axis=False),'save','reset','hover'],
active_tools=['wheel_zoom']
),
opts.Points(color='Phase', cmap='colorwheel',width=600, height=400, colorbar=True,
# invert_yaxis=True,
default_tools=['pan',WheelZoomTool(zoom_on_axis=False),'save','reset','hover'],
active_tools=['wheel_zoom']
)
)ts_plot
ts_plot (v:str, t, source_plot, kdtree=None, y:str=None, x:str=None, reference=False, post_proc_ts=None)
Plot time series with clicked point.
| Type | Default | Details | |
|---|---|---|---|
| v | str | path to pc dataset | |
| t | temporal coordinate | ||
| source_plot | source plot | ||
| kdtree | NoneType | None | kdtree, optional |
| y | str | None | path to y coordinate, must be provided if kdtree is not provided |
| x | str | None | path to x coordinate, must be provided if kdtree is not provided |
| reference | bool | False | allow set reference points (double click) |
| post_proc_ts | NoneType | None |
Usage:
dates_iso = [d[:4] + '-' + d[4:6] + '-' + d[6:] for d in dates]
dates_obj = np.array(dates_iso, dtype='datetime64[D]')phase_ts_plot = ts_plot(ps_can_rslc, dates_obj, intf_pc_plot , y=ps_can_y, x=ps_can_x, reference=True)phase_ts_plot = phase_ts_plot.redim(
t = hv.Dimension('t',label='Dates'),
v = hv.Dimension('v',label='Phase difference'),
)(phase_ts_plot.opts(
opts.Scatter(
tools=['hover'],
frame_width=500, ylim=(-np.pi, np.pi),
size=10,
)
) +\
intf_plot.opts(opts.Image(cmap='colorwheel',width=600, height=400, colorbar=True,
default_tools=['pan',WheelZoomTool(zoom_on_axis=False),'save','reset','hover'],
active_tools=['wheel_zoom']
),
opts.Points(color='Phase', cmap='colorwheel',width=600, height=400, colorbar=True,
# invert_yaxis=True,
default_tools=['pan',WheelZoomTool(zoom_on_axis=False),'save','reset','hover'],
active_tools=['wheel_zoom']
)
)
).cols(1)