import zarr
from matplotlib import pyplot as plt
import colorcet
from moraine.utils_ import is_cuda_availableSLC amplitude calibration
rslc2amp
rslc2amp (rslc:numpy.ndarray)
calculation the amplitude from SLC/SLC stack
| Type | Details | |
|---|---|---|
| rslc | ndarray | rslc, 2D/3D numpy array or cupy array |
| Returns | ndarray | amplitude, 2D/3D numpy array or cupy array |
Usage:
rslc = zarr.open('../CLI/raw/rslc.zarr/',mode='r')[:,:,1]
amp = rslc2amp(rslc)
amp_ = np.abs(rslc)
np.testing.assert_array_almost_equal(amp,amp_,decimal=4)
if is_cuda_available():
    amp_gpu = rslc2amp(cp.asarray(rslc))
np.testing.assert_array_almost_equal(amp,amp_gpu.get(),decimal=4)calamp
calamp (amp:numpy.ndarray)
calculation the calibrated amplitude from amplitude of one single SLC
| Type | Details | |
|---|---|---|
| amp | ndarray | amplitude, 2D numpy array or cupy array |
| Returns | ndarray | calibrated amplitude, 2D numpy array or cupy array |
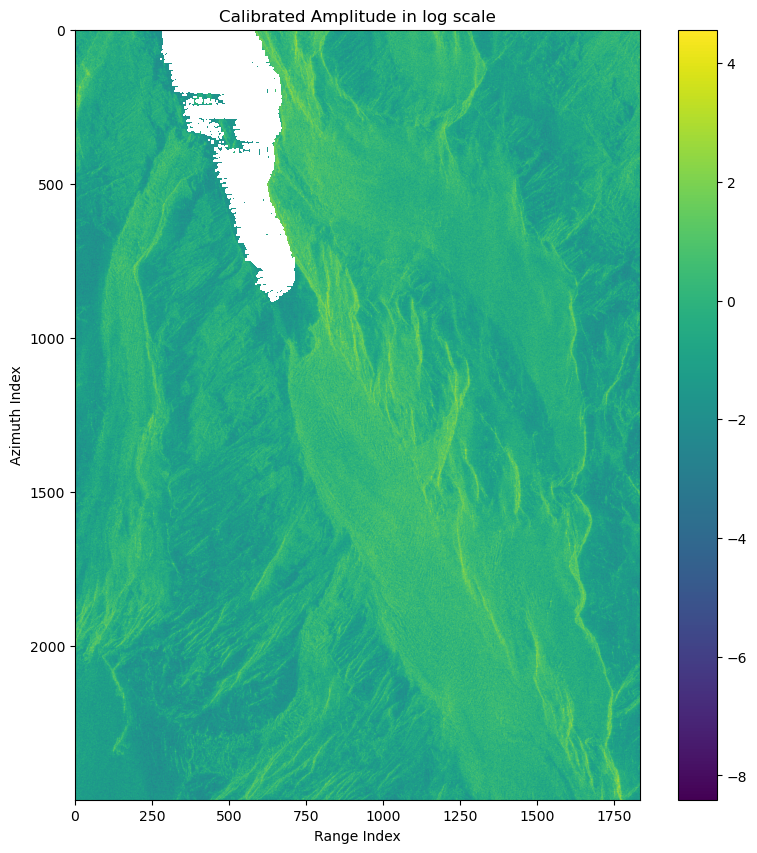
rslc = zarr.open('../CLI/raw/rslc.zarr/',mode='r')[:,:,0]
amp = np.abs(rslc)
amp_caled = calamp(amp)
if is_cuda_available():
    amp_gpu = cp.asarray(amp)
    amp_caled_gpu = calamp(amp_gpu)
    np.testing.assert_array_almost_equal(amp_caled,amp_caled_gpu.get(),decimal=3)
    # np.testing.assert_array_almost_equal(amp/np.nanmean(amp),amp_caled_gpu.get())
fig, ax = plt.subplots(1,1,figsize=(10,10))
pcm = ax.imshow(np.log(amp_caled))
ax.set(title='Calibrated Amplitude in log scale',xlabel='Range Index',ylabel='Azimuth Index')
fig.colorbar(pcm)
fig.show()